***Full Disclosure: Visit our "Disclosure Policy and Cookies" for details. Affiliate links appear on this page from Google Adsense, Amazon, Impact affiliate members, and Shareasale affiliate members.****

Are you fed up with all the social media analysis data? I sure am. This will be the last one for a while, I promise. Let me ask you this question, have you ever checked out Twitter Analytics? While doing research for this post, I took some time to see what information Twitter provides for me on my account. I will only show you the areas that would be most important to visit on at least a monthly basis, even if you don’t advertise on Twitter.
How do I get to my Twitter Analytics?
On the home page on your desktop, on the left-hand side under “More,” select the option that says “Creator Studios.” Then, select “Analytics.” That’s easy enough, isn’t it?
A quicker way is to go to https://analytics.twitter.com, and if you are logged into Twitter, it will take you right to your account’s analytics.
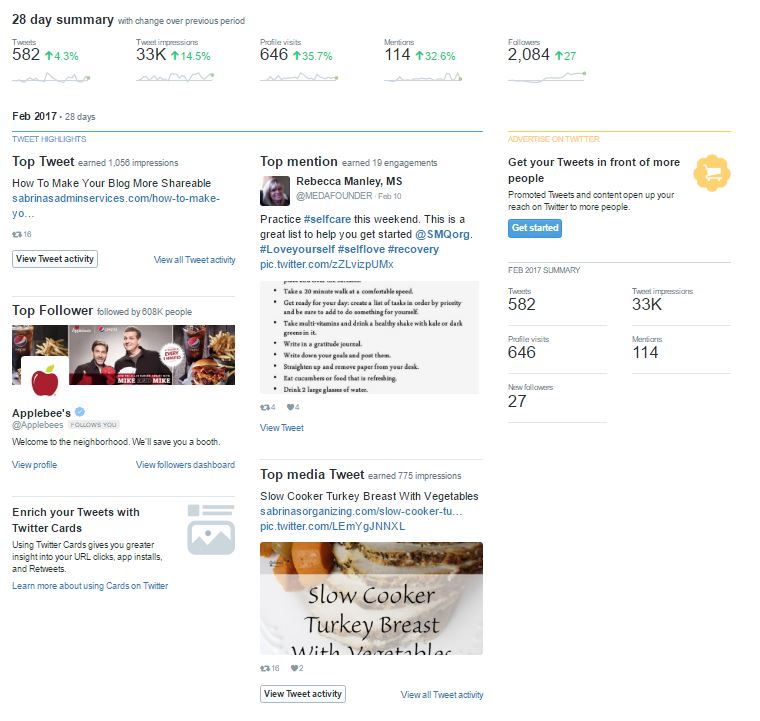
When you get to the homepage, you will notice a summary of the different areas. There are a few areas you can click through as well. We will discuss them also. This image below is for 2017, but it looks the same in 2022.

It gives you information at a glance within a month’s period. As you scroll down the page, you can see the other months as well. It goes back many years, before 2016. You can easily go back and visit a year ago and see what was popular then.
What’s on the Twitter Analytics Home Page?
At the top of the page, you will see your overall results for the month. In this section, you will see all the data for the current month. Note: as you scroll down the page, you will see the other months.
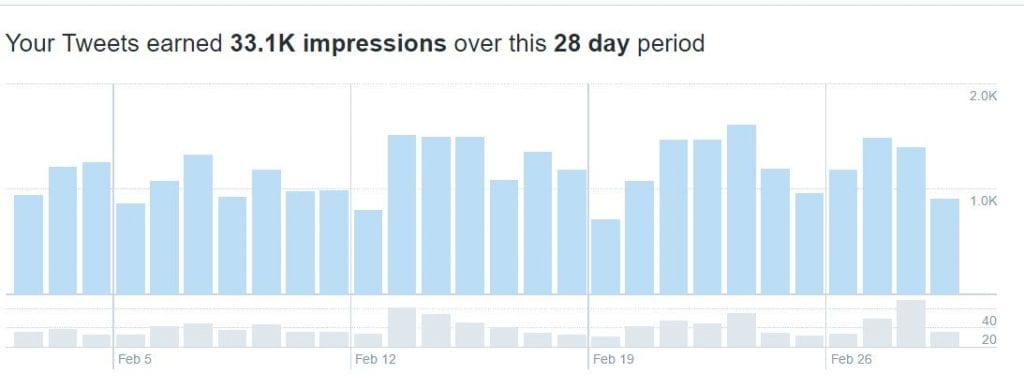
To see all the information for each month, click “View all Tweet activity” at the bottom of each section. It is located bottom of the month’s section. When you click on it, you will see the detailed activities for the current month. The image below is older, but it looks the same in 2022.

The light blue section shows the organic impression my Tweets received, and the bottom gray area is the retweeted tweets. It gives you information on the right about how many impressions you earned over the last 28 days.
Tip: Use this information to quickly determine the best day to post. You can see that Sundays are usually not the best day for me to post, but Tuesdays through Thursdays are more responsive.
In the Tweets section, you can see “Top Tweets,” “Tweets and replies,” and Promoted tweets. Promoted is where your tweets are if you are advertising on Twitter. In the Top Tweet tabs (Affiliate Link) below this graph, you will see the details for all your posts for this 28-day period. The image below looks a lot like the 2020 version.

If you wish to promote a certain tweet that performs well, click the promote button. Twitter will guide you through various steps to set up your promoted Tweet.
What’s the Engagements Section?
The Engagement section shows 28 days of charts that show the Engagement rate, Link clicks, Retweets, Likes, and Replies. It is a quick glimpse so you can see how it is going.
If you have any further questions, you can check out Twitter’s support page. They have a lot more information to help newbies. Also, when you want to get out of this section, click on your picture again at the top right and then select view my profile. This will take you to your page. Then, select how to see your stream again.
What can I do with this data on Twitter Analytics?
You learn about your profile visits. This will show how many people are interested in who you are.
You can learn about who mentions you in tweets and your tweet impressions and engagement rate. An engagement rate is a metric to assess the average number of interactions your social media content receives per follower.
You can even learn about your follower growth and video content performance.
Well, there you have it. I hope this helps you see what areas to visit when looking for information about your Tweets. Let’s continue the conversation; what is your favorite area to visit in Twitter Analytics? Are there any questions you may have about Twitter Analytics? Feel free to leave a message below.
Please note these are affiliate links through Amazon, and at no additional cost, I will earn affiliate fees if you decide to make a purchase.


I don’t think I’ve ever looked at any of those screens! Thanks for the nice concise tutorial.